Note
Go to the end to download the full example code.
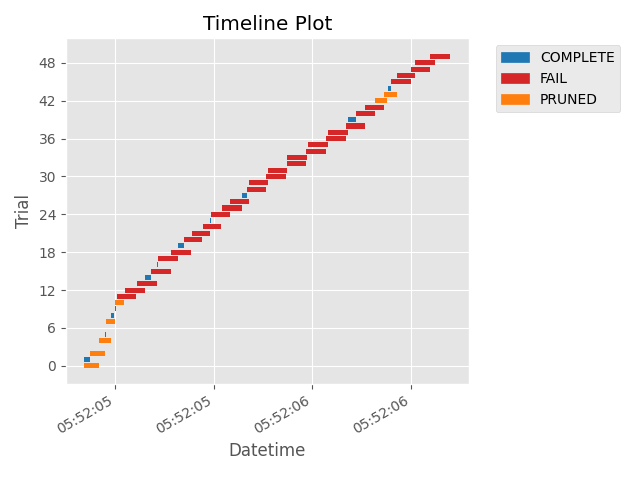
plot_timeline
- optuna.visualization.matplotlib.plot_timeline(study, n_recent_trials=None)[source]
Plot the timeline of a study.
See also
Please refer to
optuna.visualization.plot_timeline()for an example.- Parameters:
- Returns:
A
plotly.graph_objects.Figureobject.- Raises:
ValueError – if
n_recent_trialsis 0 or negative.- Return type:
Note
Added in v3.2.0 as an experimental feature. The interface may change in newer versions without prior notice. See https://github.com/optuna/optuna/releases/tag/v3.2.0.
The following code snippet shows how to plot the timeline of a study.
/home/docs/checkouts/readthedocs.org/user_builds/hvy-optuna/checkouts/latest/docs/visualization_matplotlib_examples/optuna.visualization.matplotlib.timeline.py:29: ExperimentalWarning:

plot_timeline is experimental (supported from v3.2.0). The interface can change in the future.


<Axes: title={'center': 'Timeline Plot'}, xlabel='Datetime', ylabel='Trial'>
import time
import optuna


def objective(trial):
    x = trial.suggest_float("x", 0, 1)
    time.sleep(x * 0.1)
    if x > 0.8:
        raise ValueError()
    if x > 0.4:
        raise optuna.TrialPruned()
    return x**2


study = optuna.create_study(direction="minimize")
study.optimize(objective, n_trials=50, n_jobs=2, catch=(ValueError,))

optuna.visualization.matplotlib.plot_timeline(study)
Total running time of the script: (0 minutes 2.122 seconds)