optuna.visualization
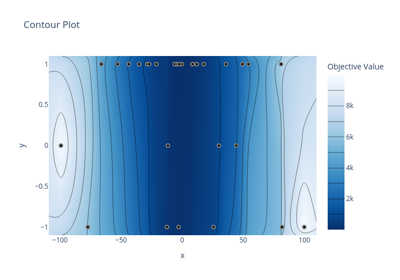
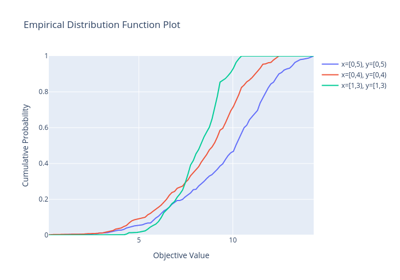
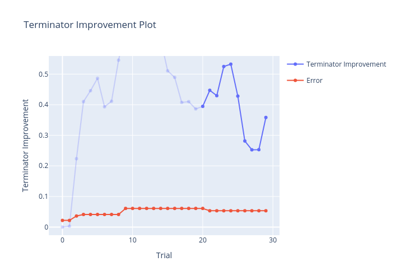
The visualization module provides utility functions for plotting the optimization process using plotly and matplotlib. Plotting functions generally take a Study object and optional parameters are passed as a list to the params argument.
Note
In the optuna.visualization module, the following functions use plotly to create figures, but JupyterLab cannot
render them by default. Please follow this installation guide to show figures in
JupyterLab.
Note
The plot_param_importances() requires the Python package of scikit-learn.


Gallery generated by Sphinx-Gallery
Note
The following optuna.visualization.matplotlib module uses Matplotlib as a backend.
See also
The Quick Visualization for Hyperparameter Optimization Analysis tutorial provides use-cases with examples.